Graph Representation using Neo4j
Introduction
Neo4j is a widely utilized database management system renowned for its capability to store and retrieve interconnected data in the form of graphs. By employing the property graph model, it efficiently represents and analyses intricate relationships among data elements. Diverging from traditional relational databases, Neo4j organizes data as nodes and relationships, facilitating the querying and examination of data patterns. The system encompasses Cypher, a query language that simplifies the extraction of insights from graph data. Additionally, it incorporates numerous plugins for graph visualization and data science tasks.
The present blog aims to provide a comprehensive overview of the outcomes derived from conducting diverse queries on a dataset comprising Twitch streamers utilizing Neo4j. Readers can effortlessly access the clustering section directly through the “Clustering Using GDS” link.
Setup
The dataset utilized in this study encompassed a substantial number of entities, consisting of over 150,000 nodes and 6.5 million edges. During the investigation, it was observed that employing Cypher’s LOAD_CSV function to process the data proved to be time-consuming. However, through iterative experimentation, the researchers identified that Neo4j’s admin-import terminal command enabled them to swiftly establish the network configuration in less than a minute.
Remarkably, the program exhibited exceptional performance by loading a network comprising 168,114 nodes and 6,797,557 edges in approximately 20 seconds, while ensuring the preservation of all node properties. Conversely, utilizing the LOAD_CSV approach to solely load the edges would consume more than 40 minutes.
It is noteworthy that the nodes_header.csv and edges_header.csv files accompanying the command contain essential information regarding the data types, in addition to the headers. This additional data-type specification is crucial for ensuring accurate data import, as the entries are considered as strings by default.
Cypher Queries
Neo4j’s query language, Cypher, is widely employed in data science applications due to its remarkable capability to handle intricate data connections and extract valuable insights from large datasets. Designed with a user-friendly and adaptable approach, Cypher empowers data scientists to construct complex queries that are easily comprehensible to others. Its versatility and ease of use make it a preferred choice for data scientists seeking to unlock the full potential of their data. The easiest Cypher query would be
match (n) return n
When executing this command, it will showcase the complete set of nodes within the network. Nevertheless, it is imperative to acknowledge that the Neo4j Browser imposes a constraint on the quantity of nodes that can be exhibited in a single query, albeit this restriction can be modified. Consequently, the maximum number of nodes visible on the screen at any given time will be below this threshold, and it is possible that not all nodes will be perceptible. The top 10 nodes (based on the number of connections) in this dataset may be retrieved by:
match (s)-[]->(t) return s.numeric_id, size(collect(t)) as connections order by connections desc limit 10
To set the criteria as the number of views, the Cypher command would be
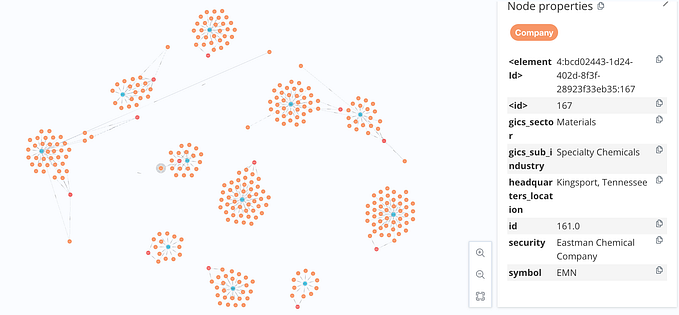
match (n) return n.numeric_id, n.views as gamers order by n.views desc limit 10Clustering, an essential process for organizing nodes with similar characteristics, involves grouping nodes based on specific criteria. Neo4j offers the Graph Data Science (GDS) plugin, equipped with a range of clustering techniques known as “Community Detection.” In our analysis of the dataset, we leveraged GDS’s Louvain community discovery algorithm to establish clusters. Through this approach, we successfully generated 19 distinct clusters.
To perform this clustering analysis, it is crucial to maintain the network in its original “graph” form. This can be achieved by executing the following command:
CALL gds.graph.project.cypher(
 ‘twitch’,
 ‘MATCH (n)
 RETURN
 id(n) AS id,
 n.views AS views’,
 ‘MATCH (n)-[]->(m) RETURN id(n) AS source, id(m) AS target’
 )
 YIELD
 graphName, nodeCount AS nodes, relationshipCount AS rels
 RETURN graphName, nodes, rels
This stores a graph with the name “twitch” and the supplied features in the current runtime.
Louvain clustering can be triggered by
call gds.louvain.write(‘twitch’, {writeProperty:’louvain’})When executing this command, the Louvain clustering algorithm is employed, resulting in the generation of a node attribute labelled “Louvain” that represents the clustering outcome. To display the clusters individually, the following code can be utilized to convert the node property into a node label.
 match (n)
 call apoc.create.addLabels([id(n)], [toString(n.louvain)])
 yield node
 with node remove node.louvain return node